
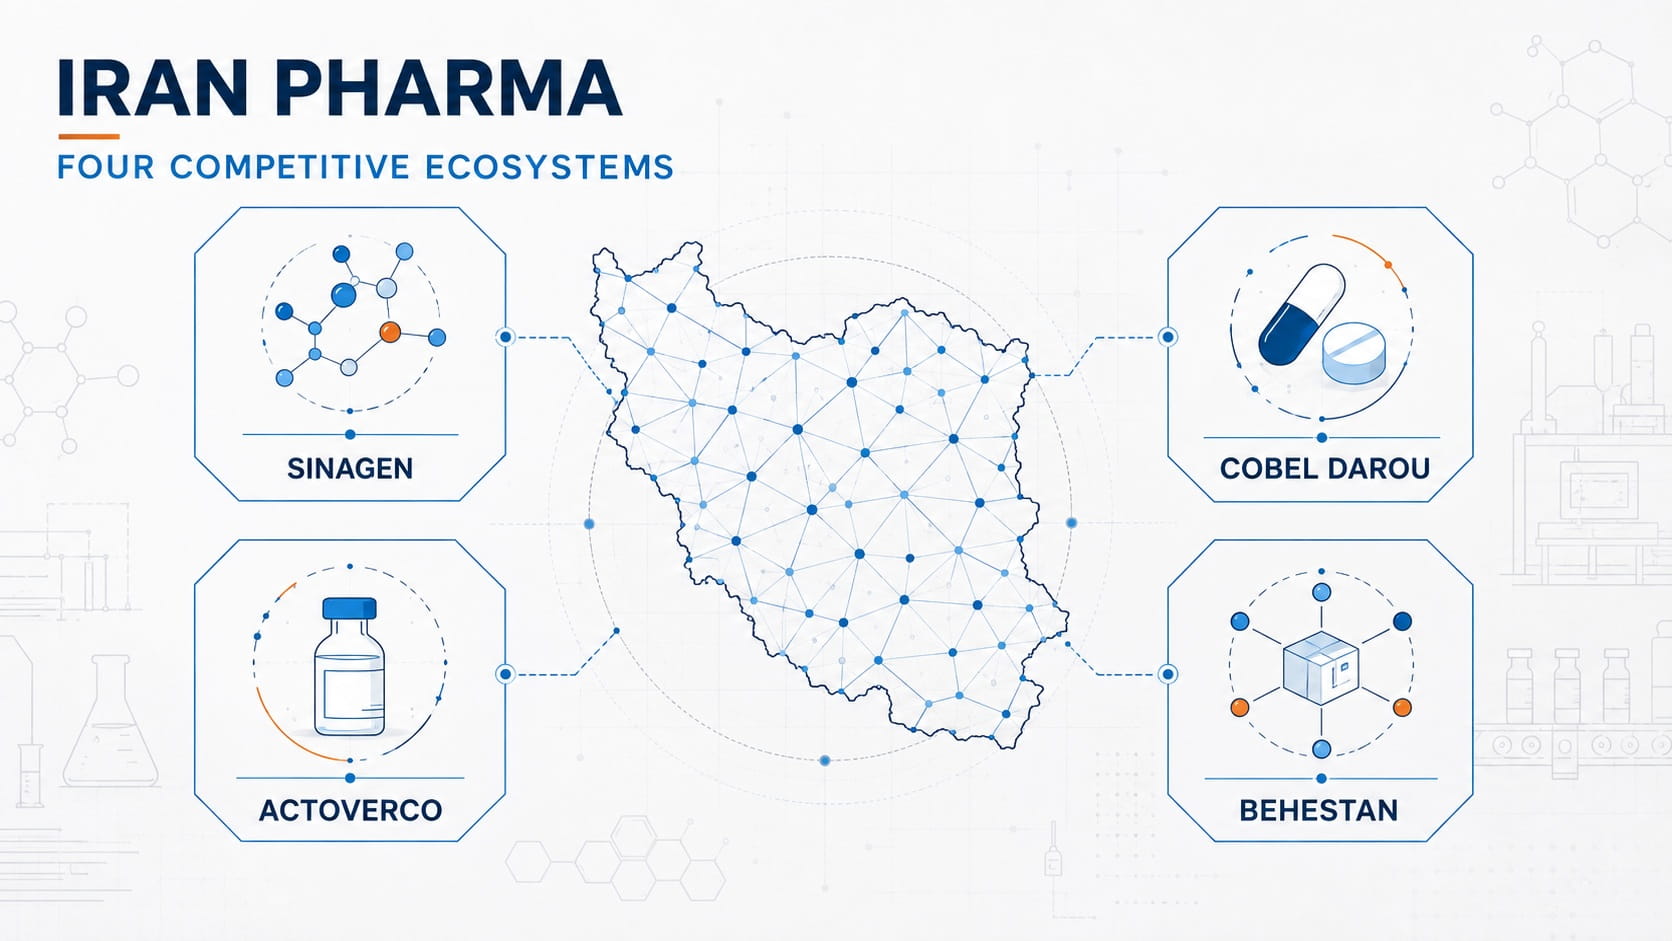
Iran Pharmaceutical Market Analysis
Iranian Main Pharmaceutical Industry Players: A Private-Sector Ecosystem Map
An outside-in analysis of Cobel, Actover, CinnaGen, and Behestan Darou/Behphar across market structure, therapeutic portfolios, market access, and strategic implications for marketing.
This interactive graph maps ecosystem structure, value-chain roles, and relationships among pharmaceutical companies. Hover over a company for a quick preview and click a node to open its detailed profile.
Iran Pharma Ecosystem Overview: Interactive Company Map
Based on public online dataHow to use the interactive graph: filter by ecosystem or value-chain role, hover over a node for a quick preview, and click a company to open a detailed panel with supporting information and sources.
N/A means no comparable public data was found for the same period and measurement layer; it does not mean zero. Solid lines indicate more directly documented relationships than ecosystem/operational or lower-confidence links.
Iran Pharma Ecosystem Overview: From Market Structure to Competition
In digital marketing, starting with the question “Which channel should we use?” is usually one step too late. Before choosing SEO, paid media, social media, CRM, or even a content strategy, we first need to understand the market in which a company operates, who the meaningful competitors are, where competition occurs across the value chain, how access to physicians, pharmacies and patients is built, and which parts of the market picture are supported by sufficiently reliable public data.
In an Iran pharma ecosystem overview, a competitor cannot be defined only by total sales, product count, or company size. Two organizations may look similar in scale while competing in very different therapeutic areas, business models, market-access routes, and stakeholder journeys. The purpose of this report is therefore to establish the layer beneath channel selection: market, business model, competition, and access.
Back to contents ↑Method for Analyzing the Iranian Pharmaceutical Industry
The Iranian pharmaceutical market may appear easy to rank at company level, but much of that statistical certainty disappears as soon as the unit of analysis shifts from a legal company to a business group or ecosystem. This report provides a high-level view of the market and four large private pharmaceutical ecosystems while keeping a clear boundary between what public evidence supports and what remains a corporate claim, estimate, or unresolved relationship.
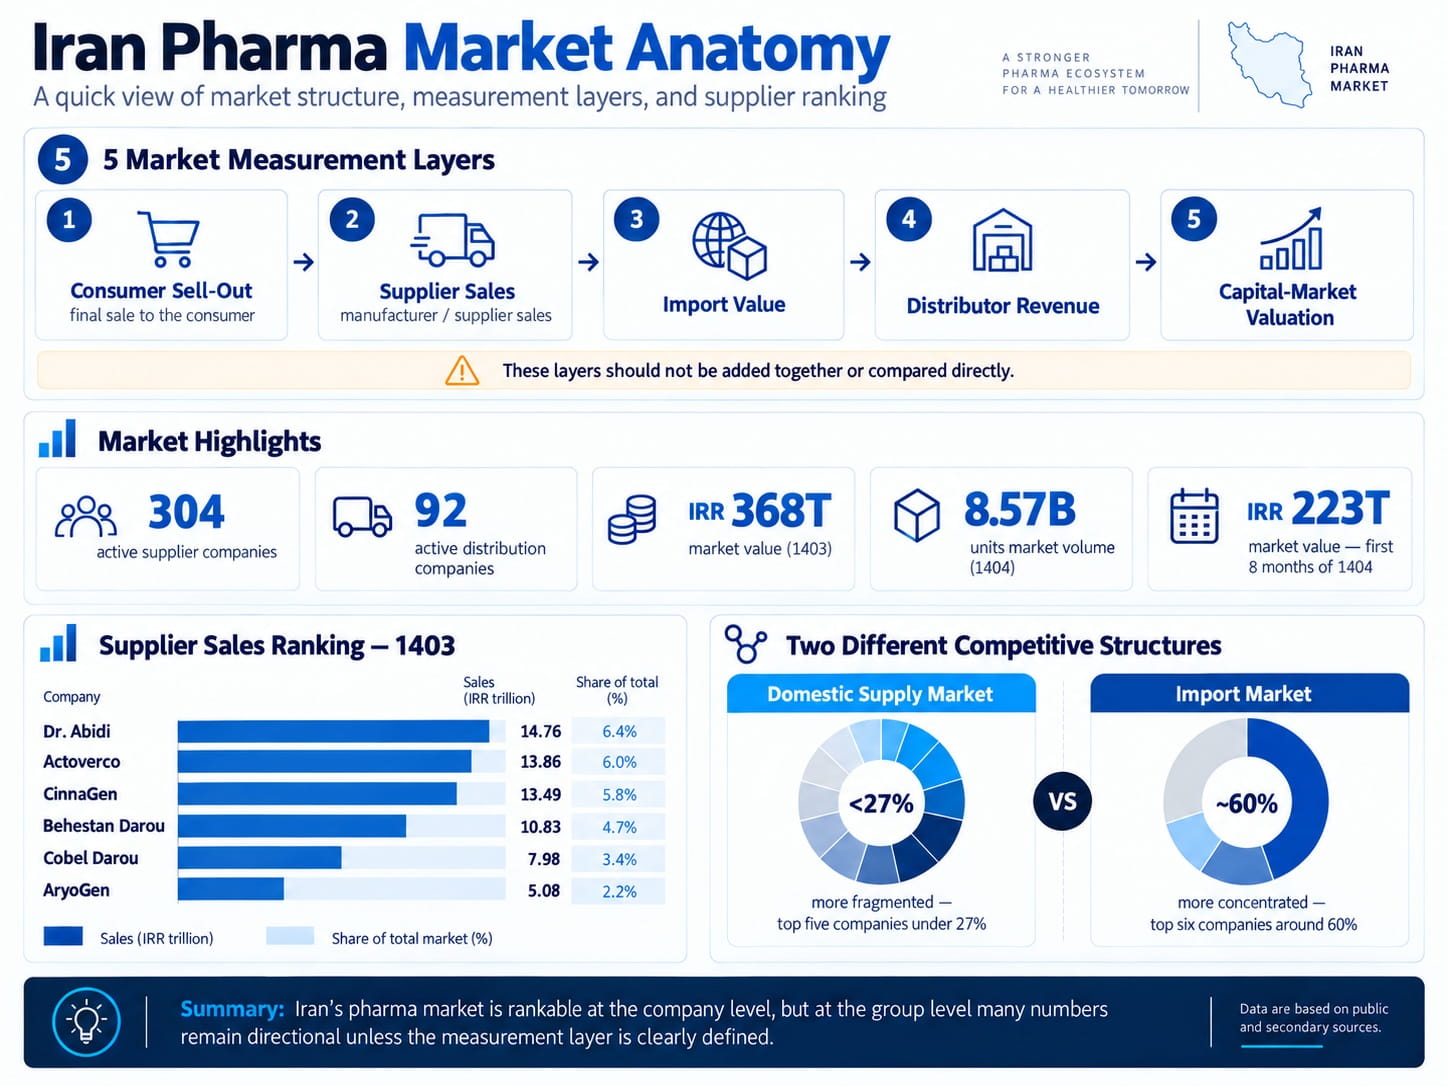
The first methodological rule is to separate measurement layers. A sales figure in pharma has a different meaning depending on where it is measured in the value chain, and figures from different layers cannot be safely added under one denominator. Five layers are intentionally kept separate here: final pharmacy-to-consumer sales, supplier sales, import value, distribution-company revenue, and capital-market valuation. Adding the supplier sales of a manufacturer to the revenue of a distributor in the same group creates the double-counting error that affects many public claims about “group market share.”
The second rule is to separate ecosystem relationship from legal ownership. Being described as a member of a business group does not by itself prove equity ownership. Ownership is recorded only when a traceable source provides a specific relationship or percentage. This distinction is especially important in the CinnaGen ecosystem, which is better represented as a network of related companies than as one publicly documented legal holding company.
The practical consequence is straightforward: with the public data reviewed here, group-level market share cannot be calculated defensibly for Behphar or Actover; for Cobel, only an incomplete public-data coverage estimate can be constructed; and for CinnaGen, the reliable published market-share figures refer to individual supplier companies rather than the ecosystem as a whole. This is treated as a known analytical limitation, not as a gap to be filled with unsupported estimates.
Back to contents ↑Iran Pharmaceutical Market Size and Structure
For Iranian year 1404, the pharmaceutical market at the final consumer-sales layer was reported at approximately Toman 368 trillion, with volume close to 57.8 billion units. This is the most useful broad denominator currently available, but it is not the same layer as supplier sales, which is used for company ranking. Ratios calculated from these two layers should therefore not be compared directly.
The first eight months of 1404 provide a more detailed structural snapshot: around Toman 223 trillion in market value, 39.1 billion units, 9,763 active licenses, 2,199 generic items, 304 active suppliers, and 92 distributors. The existence of 304 suppliers indicates a long-tail market, even though the leading positions are held by a much smaller set of companies.
For 1403, two secondary sources published different total-market figures of roughly Toman 232.1 trillion and Toman 229 trillion. The numerical gap is relatively small; the more important problem is that the underlying sales layer is not defined clearly enough in either source. Neither figure is therefore used as the denominator for company market-share calculations in this report.
Another important structural signal is the technology mix. Biologic medicines represented roughly 22% of market value in 1404. This helps explain why ecosystems with deeper biologics and biosimilar capabilities—most notably CinnaGen—compete differently from groups with broader chemical, licensed, imported, and general finished-dose portfolios. The 22% figure should be read as a category-level signal, not as the addressable market or market share of any one group.
International secondary estimates place the Iranian pharmaceutical market at around US$4.2 billion, with annual growth near 7% and volume self-sufficiency around 95%. These estimates are lower-confidence than domestic official statistics and should be read cautiously. Their main analytical value is to highlight the difference between nominal market growth and real volume growth: rapid growth in toman value can reflect inflation and price adjustments rather than an equivalent increase in consumption. High volume self-sufficiency alongside meaningful import value also suggests that imported products can represent a relatively small share of units but a much larger share of market value.
| Indicator | Value | Period | Data status |
|---|---|---|---|
| Market value — final consumer sales | Toman 368tn | 1404 | Accepted reference denominator |
| Market volume | 57.8bn units | 1404 | Accepted |
| Market value — first eight months | Toman 223tn | 8M 1404 | Official data via secondary publication |
| Market value | Toman 232.1tn / 229tn | 1403 | Conflicting / layer not clearly defined |
| Biologics share of market value | 22% | 1404 | Accepted |
| Active supplier companies | 304 | 8M 1404 | Official data via secondary publication |
| Active distribution companies | 92 | 8M 1404 | Official data via secondary publication |
| Active licenses / generic items | 9,763 / 2,199 | 8M 1404 | Official data via secondary publication |
4 Main Pharmaceutical Private Companies in Iran: Ecosystem Comparison
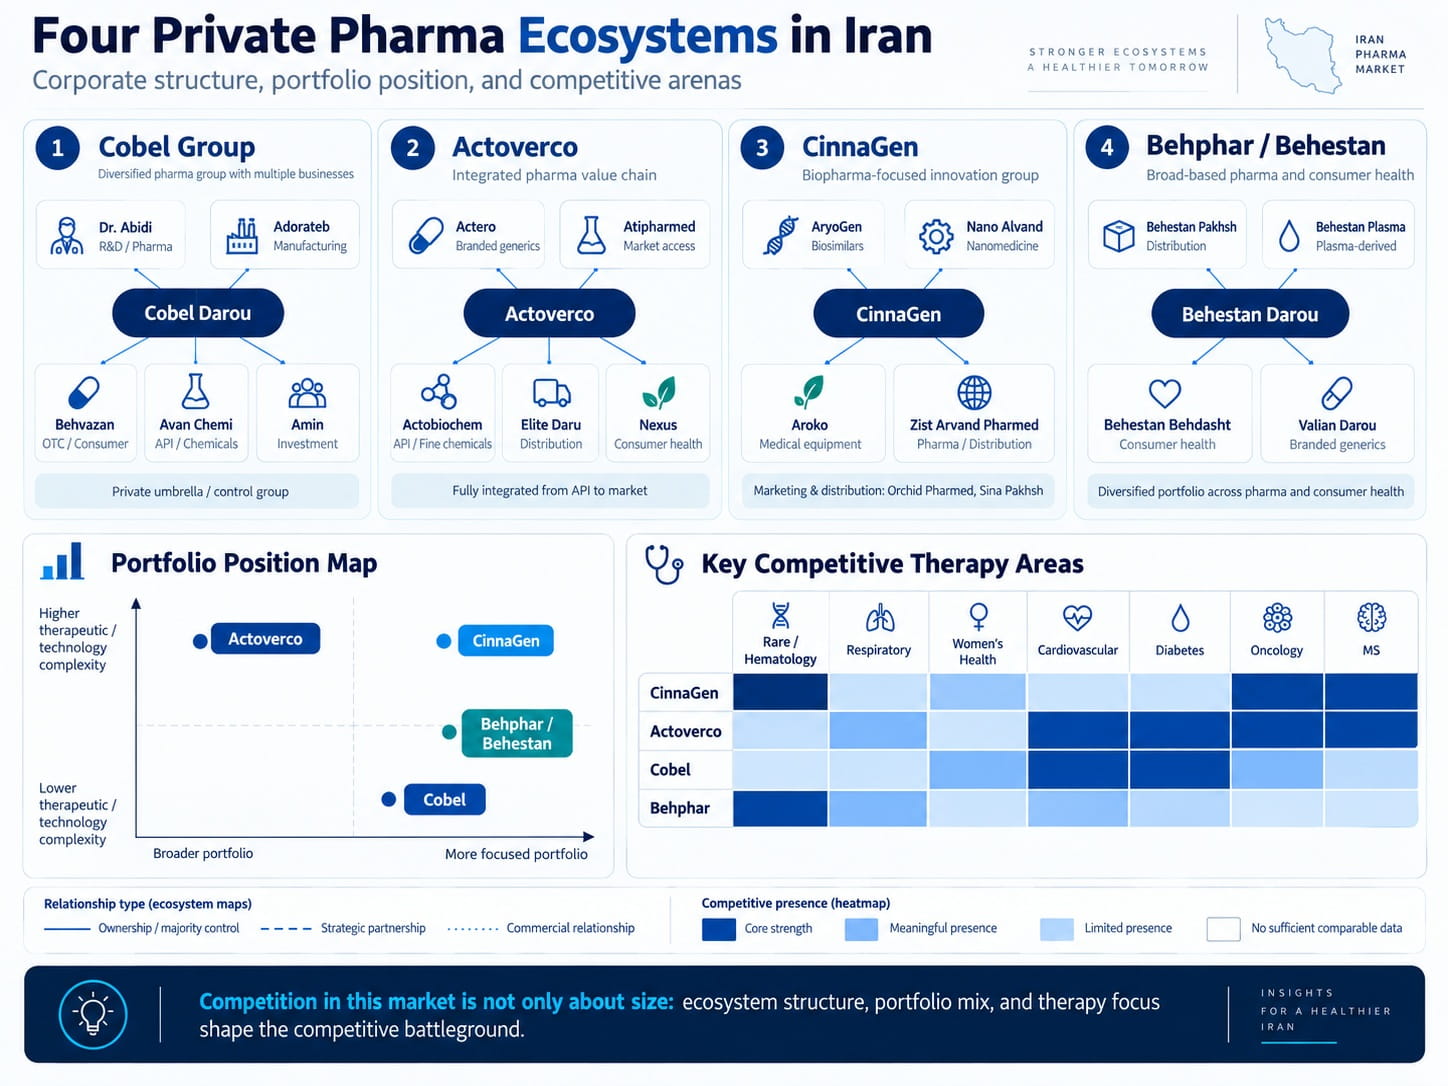
This report focuses on four major private-sector pharmaceutical ecosystems. They differ fundamentally in legal architecture, value-chain coverage, ownership transparency and public data availability. Those structural differences explain why some entities can be mapped as formal subsidiaries while others should only be represented as operational, control, partnership or historical relationships.
About Cobel Darou and the Cobel Group
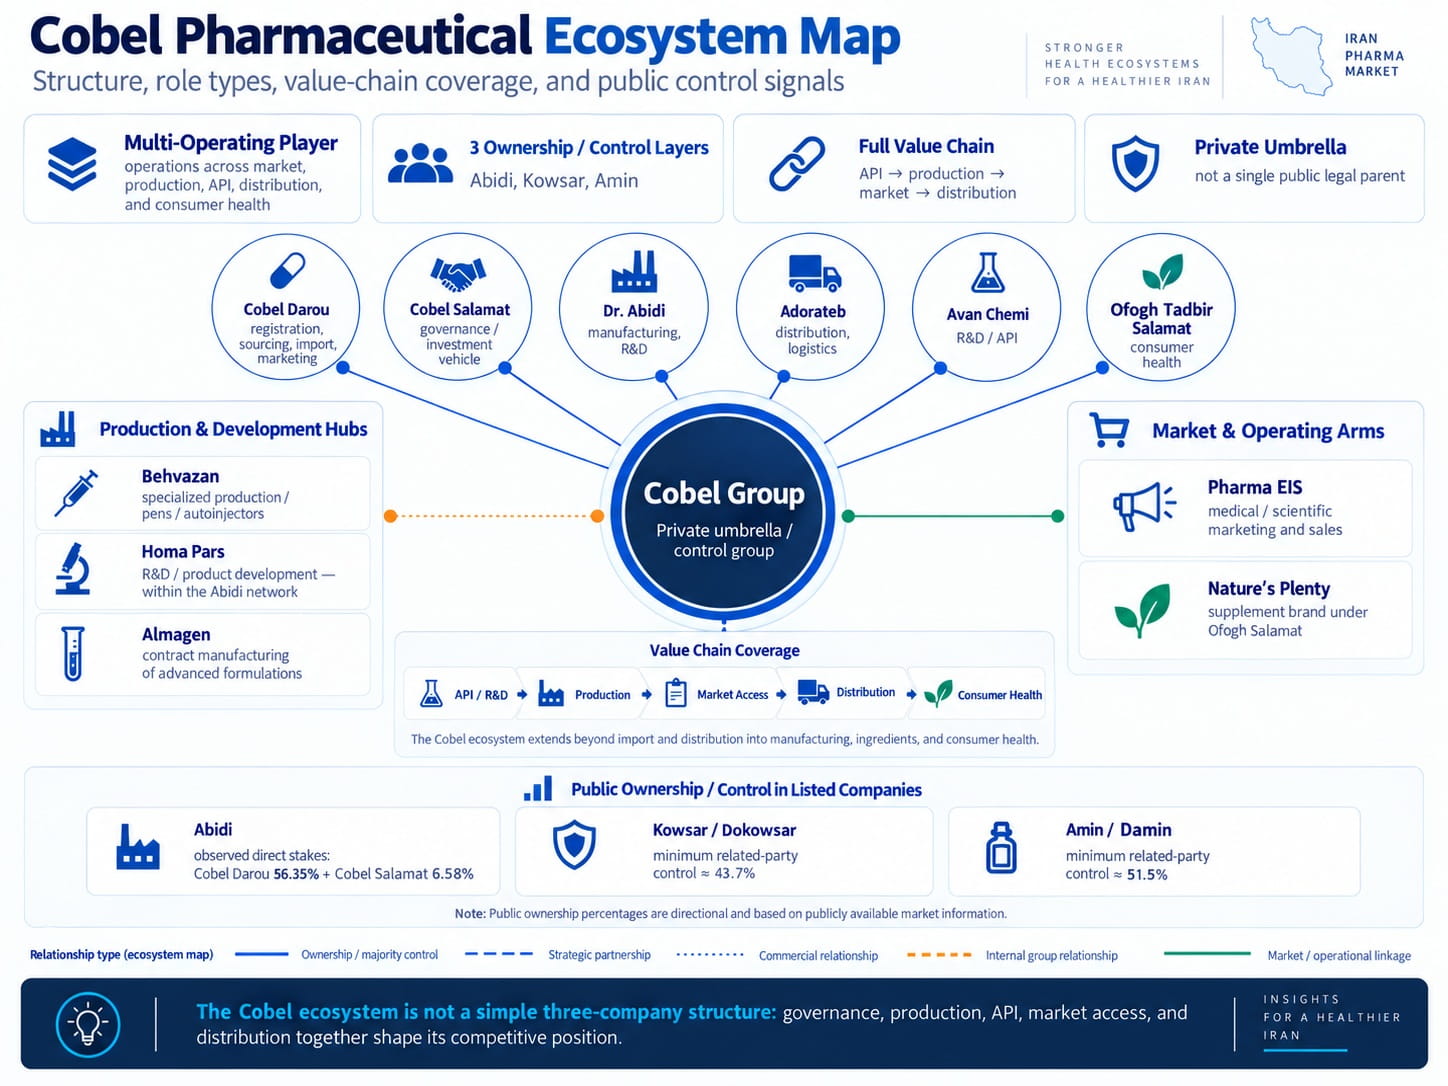
The current review shows that Cobel should not be simplified into a three-part structure or treated as one publicly documented legal holding company. Cobel Group® is modeled here as a private organizational/control umbrella, with the underlying legal entities kept separate. The group currently self-reports more than 3,000 employees, over 80 national brands, and presence in more than 15 therapeutic areas. These figures indicate organizational scale; they are not substitutes for consolidated financial statements or group market share.
At the governance layer, Cobel Darou and Cobel Salamat are separate legal entities. In the shareholder register observed on 7 Shahrivar 1405, Cobel Darou directly held approximately 56.35% of Dr. Abidi Pharmaceuticals and Cobel Salamat approximately 6.58%. The older “about 77% Cobel Darou ownership of Abidi” figure is therefore not used as the current position. Control of Abidi within the Cobel network is well supported, but the final economic beneficial ownership is not flattened into one percentage because related entities and intra-group transfers sit between legal and economic control.
The operational perimeter is broader than an import-and-manufacturing model. Cobel Darou covers importation, registration, supply and marketing; Pharma Operations is modeled as an internal matrix function for Marketing, Sales and Medical rather than a separate company; and Adorateb is the national distribution arm. Manufacturing and technology extend through Dr. Abidi, Behvazan in specialized manufacturing, Avan Chemi in API and R&D, and Homa Pars Daroo in R&D and product development. Cosar Pharmaceutical and Amin Pharmaceutical are public manufacturers controlled through the Abidi/Cobel network, while Ofogh Tadbir Salamat covers Consumer Health and supplements. Almagen Darou is retained only as a historical/operational contract-manufacturing relationship because current 1405 group membership is not publicly established.
| Layer | Entities | Main role | Relationship status |
|---|---|---|---|
| Umbrella and governance | Cobel Group®, Cobel Salamat | Group identity, governance and investment | The umbrella is not assumed to be one legal parent; Cobel Salamat is a separate legal entity |
| Commercial and market operations | Cobel Darou, Pharma Operations | Import, registration, supply, marketing, sales and Medical | Cobel Darou is a legal company; Pharma Operations is an internal division |
| Manufacturing and technology | Dr. Abidi, Behvazan, Avan Chemi, Homa Pars | Finished dose, specialty manufacturing, API and R&D | Abidi is controlled by the network; Behvazan/Homa Pars link through Abidi; Avan is a current group member |
| Public manufacturing base | Cosar, Amin | High-volume production, antibiotics, generics and contract manufacturing | Network control through Abidi and related ownership vehicles; no single flattened UBO percentage |
| Consumer Health | Ofogh Tadbir Salamat / Nature’s Plenty | Nutritional supplements and consumer health | Current group member; exact public equity percentage unresolved |
| Distribution | Adorateb | National distribution and Market Access | Current group member; 27 centers and 15,000+ pharmacies/healthcare points reported |
| Historical / unresolved | Almagen Darou | Contract manufacturing of newer medicines | Historical/operational relationship documented; current 1405 membership unconfirmed |
About Actover Pharmaceutical Group
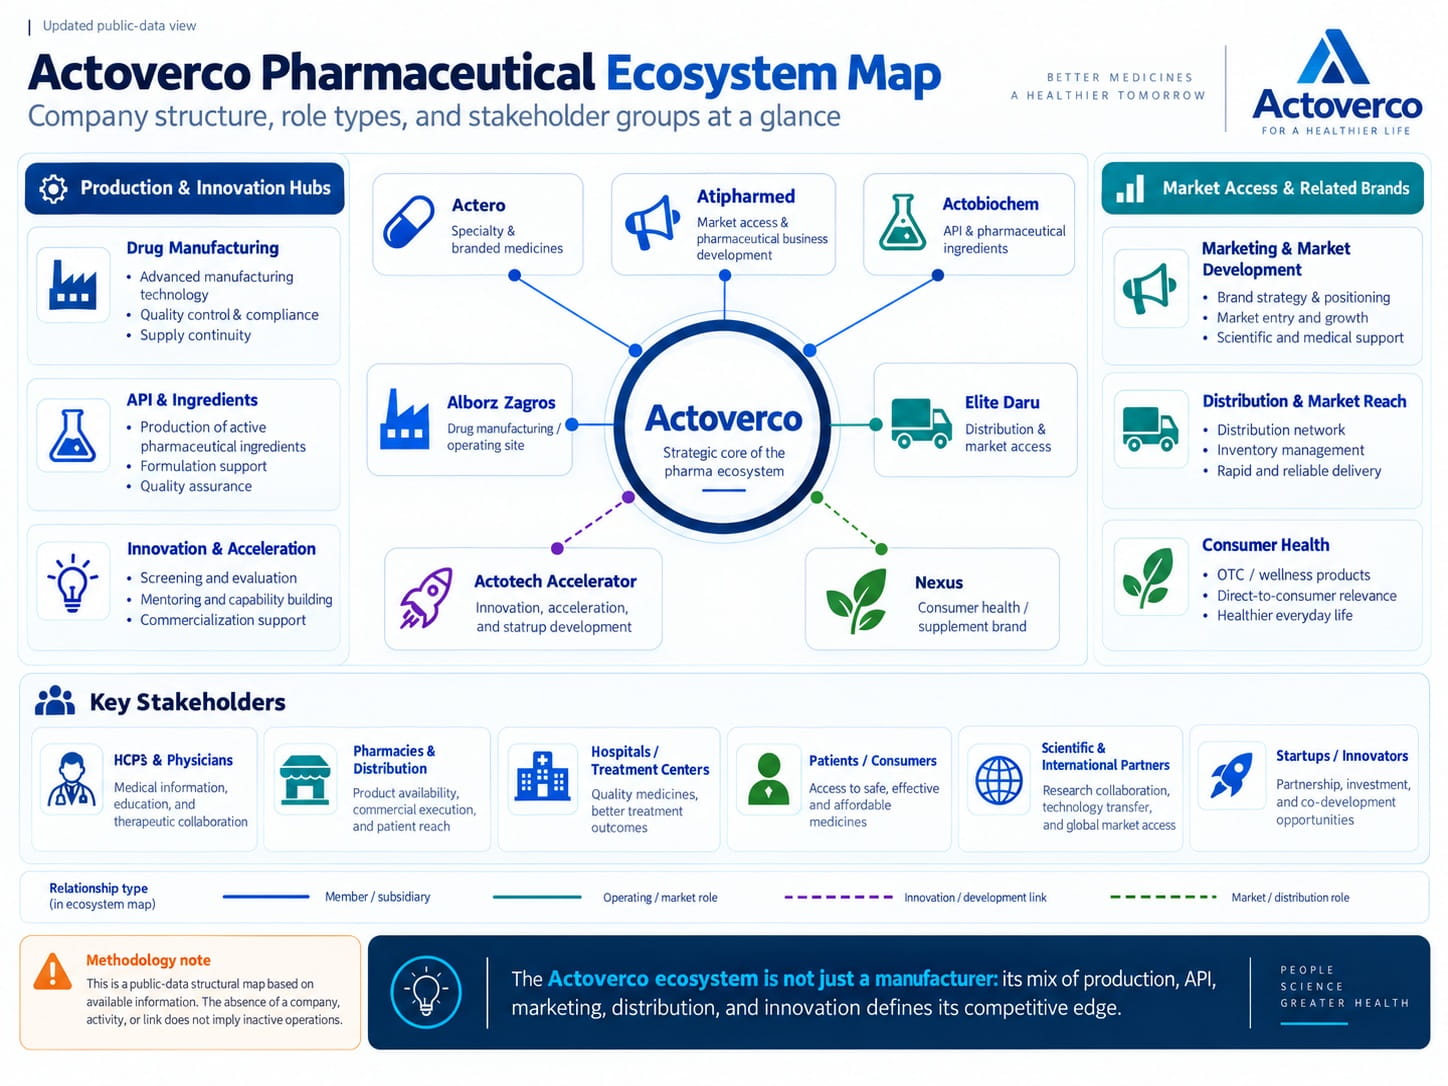
The current evidence also suggests that Actover Pharmaceutical Group should not be treated as one publicly documented legal holding company. In this report, Actover is modeled as a private/family-controlled group umbrella, with Actoverco as the core legal and operating company. It is therefore important to distinguish Actoverco as a company, the Actover pharmaceutical ecosystem, and broader pharma-plus-food group claims when interpreting employee, factory or product counts.
The current operating map contains five principal pharmaceutical production companies: Actoverco, Actero Pharma Middle East for oncology/high-potency products, Ati Pharmed for women’s health and hormonal products, Alborz Zagros for hazardous/specialty oral solids, and Actobiochem for API and development. Nexus is retained as the Consumer Health/supplement arm. Actover Biotech is not modeled as a separate legal company; it is represented as a biotech site/division within Actoverco. Actotech is the innovation and acceleration arm rather than a pharmaceutical manufacturer.
At the market-access layer, Elite Darou distributes products from Actover factories and public sources indicate roughly 600 employees and around 21–22 operating locations, but current legal group ownership is not established publicly enough to model it as an equity subsidiary. Scale claims also require strict scope control: Actoverco at company level reports around 2,000+ employees and roughly 320–350 products, while the pharmaceutical-group narrative refers to 3,000+ employees and 500+ products. These are different scopes, not numbers that should be merged.
| Layer | Entities | Main role | Relationship status |
|---|---|---|---|
| Legal/operating core | Actoverco | Core manufacturing, brand, sales and operations | Core legal company; not assumed to be the registered parent of every group entity |
| Current specialty manufacturing | Actero Middle East, Ati Pharmed, Alborz Zagros | Oncology/high-potency, women’s health and hazardous/specialty medicines | Current operating manufacturers with distinct sites/brands |
| API and development | Actobiochem | API, formulation and development | Current group company; API sales must remain separate from finished-drug market layers |
| Consumer Health | Nexus | Supplements and consumer health | Current group company; not counted among the five specialty Rx production companies |
| Internal site/division | Actover Biotech | Biotech and recombinant manufacturing capability | Modeled as an Actoverco site/division, not a separate legal company |
| Innovation | Actotech | Acceleration, investment, mentoring and innovation | Non-manufacturing innovation arm |
| Operational distribution | Elite Darou | National distribution and market access | Operational distribution relationship; current equity membership not publicly proven |
About CinnaGen Pharmaceutical Group
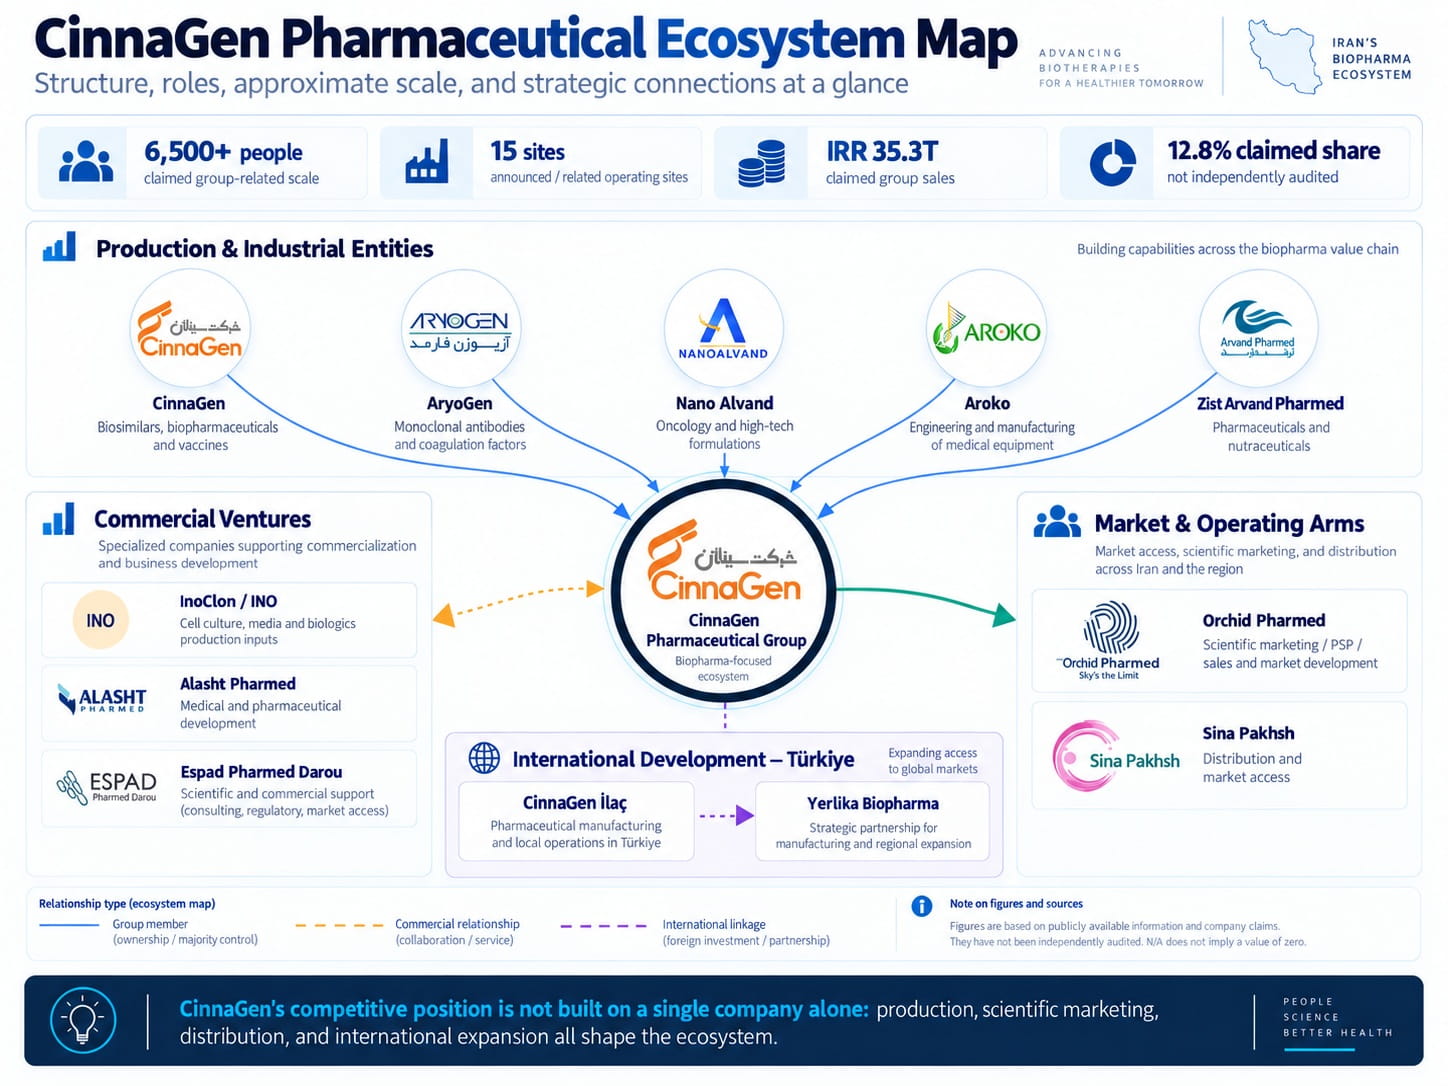
Internationally, the historical CinnaGen İlaç operation in Turkey continues under Yerlika Biopharma. The entry of Ziraat Portföy Element GSYF and the joint-control restructuring in November 2025 means that describing the 2026 operation as “100% owned by CinnaGen Iran” is no longer defensible from the public evidence reviewed. In Europe, Zandoriah (teriparatide) received EU marketing authorization on 27 April 2026. This is an important regulatory and international signal, but it does not by itself prove sales or market share in individual European markets.
Sina Pakhsh Tamin is the active legal distribution company previously known online as Cinna Distribution Gen / Sina Pakhsh Gen. Current official pages report 26 operating centers plus 3 sales centers, 3,865+ items, 14,533+ customers and 112+ suppliers. These are current company self-reported figures rather than independently audited market statistics.
Orchid Pharmed is the scientific marketing and commercial operating arm, covering sales, clinical studies, Pharmacovigilance, Market Access, Health Data Science and patient support. OrchidLife is not a separate company; it is Orchid’s patient-relations/PSP function. Its current interface lists 40 selectable cities while its About page refers to 80+ training centers and a 24/7 support line. AlefLife is a multiple-myeloma educational platform, not a legal company.
| Layer | Entities | Main role | Relationship status |
|---|---|---|---|
| Current 1405 core | CinnaGen, AryoGen Pharmed, NanoAlvand, Aroko, Zist Arvand Pharmed | Biotech, manufacturing, formulation and engineering | Current core membership described publicly; exact ownership of every private entity is not public |
| Operating arms | Orchid Pharmed, Sina Pakhsh Tamin | Scientific marketing, Clinical, PSP and distribution | Documented operating relationship; exact public ownership percentages unavailable |
| International development | Yerlika / historical CinnaGen İlaç | mAb/protein manufacturing and technology transfer | Historical affiliate; ownership structure was reorganized in 2025 |
| Commercial partners | InoClon, Alasht Pharmed, Espad Pharmed Darou | Technical cooperation, supply and co-marketing | Commercial partners; subsidiary status not established |
CinnaGen is therefore best read as a multi-layer pharmaceutical ecosystem, not as one publicly disclosed legal holding company. The currently described 1405 core comprises CinnaGen, AryoGen Pharmed, NanoAlvand, Aroko and Zist Arvand Pharmed, while Orchid Pharmed and Sina Pakhsh Tamin provide major commercial/patient and distribution capabilities.
About Behphar Pharmaceutical Group and Behestan Darou
Among the four ecosystems, Behphar Pharmaceutical Group has the clearest traceable legal root. Behphar Pharmaceutical Investment is a registered legal holding entity, and the group’s current official website presents six specialist companies as its operating structure. This makes the holding-to-company relationship more directly mappable than the network-style structures of CinnaGen, Cobel and Actover.
The commercial core includes Behestan Darou for Market Access, importation, licensing and commercialization; Darousazi Behestan / Behestan Manufacturing for domestic manufacturing and technology transfer; and Behestan Pakhsh for national distribution. Behestan Behdasht covers Consumer Health, OTC and supplements; Behestan Plasma covers plasma collection and PDMP supply; and Valean Darou focuses on specialty therapeutics and international access.
Behphar currently self-reports 2,000+ professionals, more than 20 regional distribution centers, nationwide coverage, capacity for more than 350 million tablets/capsules, 20 million injectable vials, and more than 200,000 liters of annual plasma-collection capacity. These are organizational scale claims and are not used as group market share or consolidated sales.
| Company | Main role | Structural note | Graph status |
|---|---|---|---|
| Behphar Pharmaceutical Investment | Holding and group governance | Formal legal root; six current specialist companies listed by the group | Root node · solid relationship |
| Behestan Darou | Market Access, importation, licensing and commercialization | National ID 10102165778; company claims 350+ professionals and 15+ international partners | Current member |
| Darousazi Behestan | Manufacturing, technology transfer and contract manufacturing | National ID 10102853854; historical name Behestan Tolid | Current member |
| Behestan Pakhsh | National Distribution & Logistics | 20+ regional centers, 23,000+ pallet capacity and 160+ vehicles; corporate self-claims | Current member |
| Behestan Behdasht | Consumer Health / OTC / Supplements | National ID 10102853835; distinct public content and social assets | Current member |
| Behestan Plasma | Plasma Collection & PDMP Supply | Five currently visible collection centers; group claims 200,000+ L annual capacity | Current member |
| Valean Darou | Specialty Therapeutics & International Access | Current focus includes ophthalmology, rare diseases and respiratory health | Current member |
| Group | Root structure | Confirmed operating entities | Workforce scale | Manufacturing footprint |
|---|---|---|---|---|
| Cobel | Private organizational/control umbrella; one public legal root not assumed | 10 current entities + 1 operating division; 1 historical relationship | 3,000+ group self-claim | Multiple manufacturing/API sites; public consolidated site count N/A |
| Actover | Private brand/control umbrella; one public legal root not assumed | 5 principal pharma manufacturers + Consumer Health + biotech site + innovation arm + distribution relationship | 3,000+ in pharma-group narrative; 2,000+ at Actoverco level | Five main production companies, plus Actoverco biotech site |
| CinnaGen | Related ecosystem; not one publicly disclosed legal holding | 5 core companies + 2 major operating arms | 6,500+ management claim for wider group | 15 factories — management claim |
| Behphar / Behestan | Formal legal pharmaceutical holding | 6 current specialist companies | 2,000+ group self-claim | Pharma manufacturing + distribution network + five visible plasma centers; consolidated manufacturing-site count N/A |
Workforce and site figures are indicators of organizational scale, not substitutes for market share. None is used as a market-share proxy in this report.
The four structures also differ in public transparency. Behphar currently provides the clearest official list of operating subsidiaries. Actover publishes a visible set of companies and sites, but its legal core, pharmaceutical ecosystem and non-manufacturing/distribution arms must remain distinct. Cobel has the analytical advantage of public listed-company and shareholder-register evidence, yet control is distributed across multiple related legal entities, so direct shareholding, managerial control and ultimate economic ownership should not be collapsed into one number. CinnaGen remains a networked ecosystem with variable boundaries and incomplete public ownership disclosure across private entities.
Four Levels of Pharmaceutical Competition
For marketing purposes, “competitor” needs to be defined at more than one level. A company can be a corporate-scale peer without being a direct competitor in a specific therapeutic area, stakeholder journey or channel.
| Competition layer | Management question | Suggested evidence |
|---|---|---|
| Corporate competition | Which organizations are comparable in scale, resources and enterprise capabilities? | Workforce, manufacturing footprint, legal structure and ecosystem boundary |
| Portfolio competition | Where do therapeutic areas, molecules and dosage forms genuinely overlap? | Therapeutic area, molecule, dosage form and portfolio depth |
| Channel competition | Who competes for access to physicians, pharmacies, patients and treatment networks? | Distribution, medical/scientific teams, patient support and access infrastructure |
| Attention competition | Who competes for stakeholder attention in information and digital environments? | Search, content, social and owned digital assets |
The implication is simple: digital competitor analysis should not begin by comparing a few domains or social accounts. First define what kind of competition each domain or account actually represents.
Who Makes Up the Rest of Iran's Pharmaceutical Market?
The same methodological rule applies here: lock the measurement layer first. The ranking numbers in this article primarily come from 1403 supplier sales, so they are neither consolidated group shares nor pharmacy sell-out, prescription share, or patient-level consumption.
“Competitor” is therefore not a fixed list of four names. In biologics and specialist therapies the competitive field looks one way; in high-volume generics it looks different; specialty imports create another set; and distribution has its own concentration and network logic. This directly affects how a competitive set should be defined for digital analysis.
Therapeutic Competition Across Iranian Pharmaceutical Companies
A precise numerical comparison of product portfolios is not possible without a standardized molecule-level dataset. What public information does support is a qualitative map of therapeutic presence and the level of competitive overlap by therapeutic area and channel.
The CinnaGen ecosystem retains particular depth in multiple sclerosis, oncology/hematology and autoimmune disease, with visible activity in fertility, rare disease, metabolic/endocrine, ophthalmology and infectious disease. Newer portfolio evidence also increases the visibility of diabetes/obesity and selected oncology and ophthalmology products. Cobel is broader than a simple import-plus-Abidi model: Amin and Cosar add cardiovascular, diabetes, oncology, respiratory, CNS, GI, renal, infectious-disease and pain portfolios; Avan adds upstream API capabilities across several areas; and Ofogh adds a Consumer Health layer. Supplement presence is not treated as equivalent to Rx therapeutic strength.
CinnaGen’s EU marketing authorization for Zandoriah in April 2026 is an important signal of regulatory and international-development capability, but it is not interpreted here as European sales or market share.
Portfolio breadth versus depth is another meaningful structural distinction. Actover currently follows a broad multi-therapeutic model, while CinnaGen has deeper specialization in several higher-barrier biotech categories. Cobel spans API/R&D, specialty manufacturing, high-volume finished dose, Consumer Health and national distribution. Behphar combines specialty import/Market Access with domestic manufacturing, Consumer Health, plasma infrastructure and specialty therapeutics. Turning these observations into a quantitative breadth/depth score would require one standardized dataset of molecules, brands and therapeutic areas across all four groups.
| Competitive pair | Main overlapping areas | Competition level | Primary arena |
|---|---|---|---|
| CinnaGen vs Actover | MS, oncology, diabetes, women’s health | Direct | Specialists and chronic-care patients |
| Actover vs Cobel | Cardiovascular, diabetes, oncology, respiratory | Direct | Physicians and pharmacy channel |
| Cobel vs Behphar | Specialty imports, cardiovascular, diabetes, distribution | Direct | Distribution access and international brands |
| CinnaGen vs Cobel | Oncology, diabetes, adjacent consumer-health categories | Strong adjacency | Different channel models |
| Actover vs Behphar | Diabetes, oncology, urology | Strong adjacency | Domestic manufacturing vs specialty access/import models |
| CinnaGen vs Behphar | Oncology, rare disease, hematology | Adjacent | Local biologics vs specialty-access portfolios |
Two competitive battlefields stand out. The first is multiple sclerosis, where CinnaGen and Actover both have meaningful depth but different therapy mixes and dosage-form logic. Competition therefore occurs not only at molecule level but around specialist education, treatment pathway and patient preference.
The second is diabetes, obesity and GLP-1/GIP-related therapies. Domestic tirzepatide entries and multiple local players make this a fast-developing arena in which market positions are still being formed rather than fully stabilized.
Cobel and Behphar compete differently from the first pair. Both combine international-brand access with large distribution capabilities, so the competitive field can be as much about licensing, availability and pharmacy access as about a directly overlapping molecule.
Defining the Therapeutic Competitive Arena
Therapeutic overlap is only the starting point. A competitive arena becomes strategically useful when therapeutic area, stakeholder, channel and treatment-choice logic are considered together. Two groups can be direct therapeutic competitors while using different go-to-market models—or compete heavily for the same distribution channel or stakeholder without having identical portfolios.
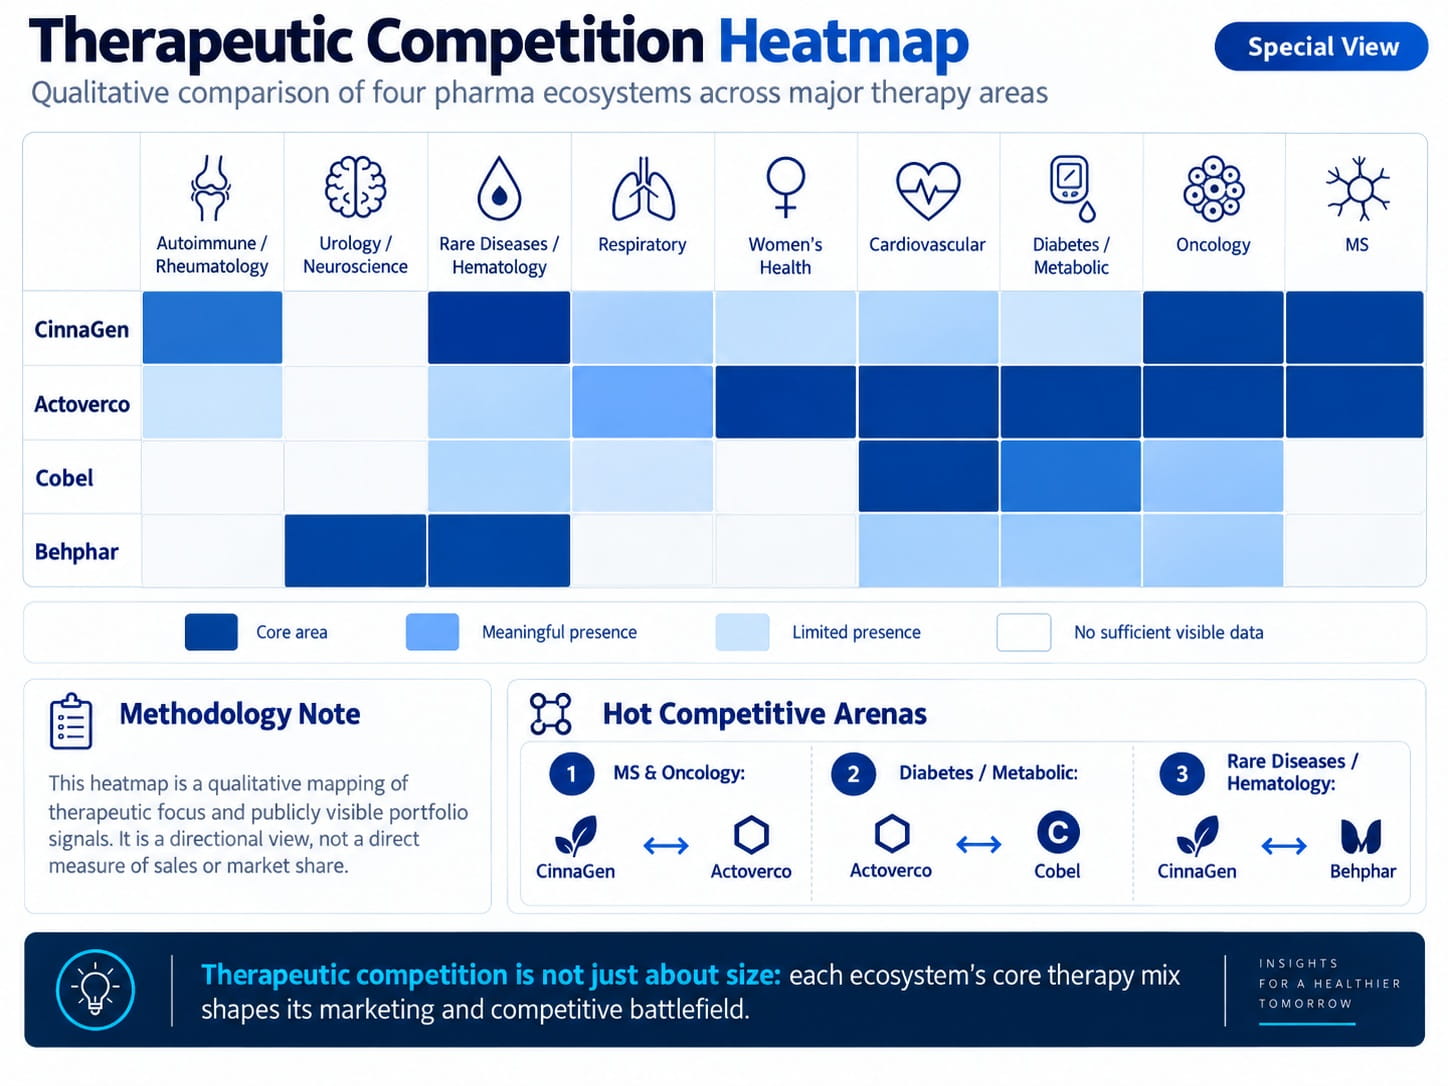
Methodology note: this heatmap summarizes visible therapeutic presence from public sources; it does not represent therapeutic-area market share. A numerical score would require a standardized molecule list, current product status and one common rubric across all four ecosystems.
Pharmaceutical Market Access and Distribution in Iran
One meaningful structural difference among the four ecosystems is how directly they control or operate distribution and market-access infrastructure. In a market with 92 active distributors, an aligned distribution network can affect reach, availability, speed and visibility—but financial advantage cannot be inferred without internal economics.
Cobel operates through Adorateb, which currently reports 27 distribution centers, 1,000+ employees and access to more than 15,000 pharmacies, hospitals and healthcare facilities. Behphar operates Behestan Pakhsh, with 20+ regional centers, national coverage, substantial warehousing and cold-chain capability. Actover distributes through Elite Darou, with public figures around 600 employees and 21–22 locations, although the current legal ownership relationship is kept conservative in this analysis.
CinnaGen is no longer an exception without a confirmed distribution arm. Sina Pakhsh Tamin is the active distributor previously known as Cinna Distribution Gen / Sina Pakhsh Gen; current official pages report 26 operating centers plus 3 sales centers, 3,865+ items, 14,533+ customers and 112+ suppliers. In parallel, Orchid Pharmed covers scientific marketing, sales, Clinical and PV, while OrchidLife provides a visible patient-support and education layer.
The competitive implication is that distribution, scientific marketing and patient support can coexist within the same ecosystem. They should not be treated as mutually exclusive go-to-market models. The public evidence reviewed here can show that these capabilities exist; it cannot establish which model generates superior economics.
Distribution, Scientific Teams and Patient Relationships
Ownership or operational control of physical channels can affect availability and network coverage, while scientific marketing and Patient Support can deepen relationships with HCPs and patients. CinnaGen’s current architecture is a useful example of these layers operating together.
Back to contents ↑Stakeholders in the Iranian Pharmaceutical Market
In many industries a relatively direct customer journey can be drawn. Pharma is different: decision-making, access and use are distributed across multiple stakeholders. Depending on the product and supply model, the relevant stakeholder set can include physicians and other HCPs, pharmacies, hospitals/treatment centers, payers and insurers, distributors, patients, caregivers and regulators.
| Stakeholder | Role in the market | Marketing question |
|---|---|---|
| HCP / Prescriber | Diagnosis, prescribing and scientific trust | What information supports evidence-based clinical decision-making? |
| Pharmacy | Availability, stock, recommendation and prescription fulfillment | How are product availability and familiarity maintained? |
| Hospital / Treatment Center | Protocols, access and therapy administration | Which scientific and operational touchpoints are critical? |
| Payer / Insurance | Affordability and treatment coverage | What evidence explains therapeutic value and access implications? |
| Patient | Use, follow-up, adherence and treatment experience | Where can education, support and friction reduction improve the journey? |
| Caregiver | Support in chronic and complex treatment | What information reduces uncertainty and administration errors? |
| Regulator | Legal framework and communication constraints | What communication and data use are permitted for this audience/product? |
This is why “Is Instagram or SEO important for a pharmaceutical company?” is not, by itself, a complete management question. A better question is: for which product, which stakeholder, at which journey stage, with which objective, and under which regulatory constraints?
Back to contents ↑Digital Marketing Approach for Pharmaceutical Companies in Iran
This report is an outside-in analysis of market structure and selected pharmaceutical ecosystems. Moving from market intelligence into digital analysis requires two complementary views: one looks deeply into a single company, while the other compares one capability across several competitors. Together they help prevent a common analytical mistake—confusing visible online presence with actual digital capability.
Vertical Analysis
A company or ecosystem is reviewed from top to bottom: business model, portfolio, therapeutic areas, stakeholders, digital assets, journeys, content, search, social, HCP/patient experience and measurement.
Horizontal Benchmark
One defined capability is compared across competitors: Search Visibility, Scientific Content, Instagram/LinkedIn/YouTube/X, PR & Brand Mentions, HCP Experience, Patient Support, or observable Measurement Signals.
A Pharma Digital Marketing KPI Tree: From Reach to Business Proxy
Pharmaceutical KPIs should not be a flat list of impressions, traffic and followers. A stronger measurement design uses a logical chain so that every metric has a defined position in stakeholder behavior and a clear distance from the business outcome it is intended to inform.
Reach
- Impressions / Qualified Reach
- Branded & non-branded visibility
- Disease-query coverage
- HCP vs patient reach by segment
Qualified Attention
- Engaged scientific sessions
- HCP-verified visits
- Content depth / completion
- Returning qualified users
Action
- Scientific guide or resource download
- HCP / webinar registration
- PSP or Medical Information request
- Pharmacy / treatment-center locator use
Behavior Proxy
- Repeat visit / repeat service use
- PSP engagement continuity
- Reminder / adherence-content engagement
- Journey completion
Business Proxy
- Share of Search
- Scientific Share of Voice
- Coverage of centers / HCP touchpoints
- Qualified demand / service-adoption proxy
In a real project, every branch of the tree should be connected to a segment and stakeholder. A scientific-guide download by an HCP and a service-center lookup by a patient are different actions and should not be merged into one generic “conversion.” The same logic applies to CAC, Conversion Rate and ROAS: numerator, denominator, period and scope are part of the KPI definition itself.
Regulatory-to-Channel Framework for Pharma Digital Marketing in Iran
In pharma, a channel plan is incomplete without a regulatory gate. This article does not issue a legal opinion about which messages are permitted or prohibited; that requires review of current Iranian regulations, product type, and each company’s Medical/Regulatory procedures. What can be defined here is the operational decision logic that a specialist audit should apply.
| Channel / Property | Design question | Controls to review in an audit |
|---|---|---|
| Instagram / LinkedIn / YouTube / X | Is the audience public or professional? Is the communication corporate/disease-awareness content or product-specific? | Content approval, claims, moderation, adverse-event escalation |
| Public Website | Which information is appropriate for the public and which journeys should route to a professional environment? | Content governance, privacy, PV contact, update cycle |
| HCP Portal | Are professional verification, access rules and depth of scientific information designed appropriately? | Verification, medical review, consent, audit trail |
| Patient Support / PSP | Where is the boundary between service, education and promotion? | Consent, data minimization, case escalation, PV workflow |
| CRM / Email | How are stakeholder segments, permissions and lifecycle stages defined? | Consent, suppression, segmentation, governance, retention |
A real brand or campaign assessment should use a separate Regulatory/Medical Audit aligned with current regulations, internal SOPs and product classification.
Public Digital Footprint Assessment Framework for Pharma Companies
Public information can be used to assess a company’s visible digital footprint, but Digital Footprint is not the same as Digital Maturity. The real quality of CRM, attribution, GA4 implementation, BI, CAC economics or internal team performance cannot be proven from the outside. The radar below therefore defines audit dimensions rather than assigning scores to the four companies.
This framework is intentionally shown without scoring Cobel, Actover, CinnaGen or Behphar. A defensible score requires a fixed rubric, a defined observation window, source rules, sampling rules and explicit treatment of capabilities that are not publicly observable. Otherwise, a radar chart becomes only a polished visualization of subjective judgment.
A Specialist Digital Audit Requires a Defined Scope
This article is designed to explain the Iranian pharma sector, its competitive structure and an outside-in digital-marketing methodology. A specialist audit of one company, therapeutic area, Digital Footprint, Search/Social/PR presence, HCP/patient journey or Measurement Framework requires a separate project and deeper data.
Data Limitations in Iran's Pharmaceutical Market Analysis
In this updated version, evidence quality is more important than record count. An organizational umbrella is not treated as a legal parent; direct shareholding is not blindly added to network control; an internal department is not treated as a registered company; historical relationships are not presented as current membership; and N/A is never interpreted as zero.
| Issue | Conflict / limitation | Treatment in this report | Confidence |
|---|---|---|---|
| Iran market value, 1403 | Toman 232.1tn vs 229tn; sales layer not clearly defined | Not used as a denominator for supplier-company market share | Medium-low |
| CinnaGen 1404 scale claims | Company sales, wider group sales and share claims use different scopes | Kept separate; no consolidated group share calculated | Medium |
| CinnaGen legal structure | “Holding” language vs network/ecosystem evidence | Modeled as a related ecosystem, not one legal holding parent | Medium |
| Actover scale | Different figures for Actoverco, pharma group, and pharma+food umbrella | Each number is used only within its stated scope | Medium |
| Abidi ownership/control | Historical 67–90% claims vs current shareholder register | Current observed direct holdings shown separately; no flattened group UBO | High |
| Cobel legal root | Cobel Group® umbrella vs multiple legal entities | Analytical root = control umbrella; Cobel Darou and Cobel Salamat remain separate legal nodes | Medium |
Three data risks affect the full analysis. First, secondary-source chains: supplier-share figures are taken from a republication of the pharmaceutical yearbook rather than a directly inspected raw IFDA file. Second, time mismatch: much of the ranking data is from 1403 while broader market data is from 1404. Third, self-reporting: much of the structural and scale information comes from official corporate sites or media coverage of company presentations. These sources are useful for establishing that a capability, entity or claim exists, but they do not independently verify performance.
Three improvements would materially strengthen the dataset: direct access to the raw pharmaceutical yearbook; review of Zist Arvand Pharmed's prospectus and capital-market disclosures; and a standardized molecule-level portfolio registry for each ecosystem. The third is necessary before a qualitative overlap matrix can become a defensible quantitative competitive score.
Until those gaps are resolved, the most precise statement is: Iran's pharmaceutical market can be ranked reasonably well at individual supplier-company level, but not at consolidated private-group level from public data alone. Any group-level market-share figure remains an estimate until its denominator, consolidation perimeter and treatment of intra-group distribution revenue are made explicit.
For practical use, company-level ranking figures can be cited with the year and measurement layer. Organizational-scale figures such as employees or sites should be presented as ranges or attributed corporate claims. Any group-level market-share claim should be tested with three questions: What is the denominator? Which legal companies are included in the numerator? Has revenue from a same-group distributor been counted again?
Conclusion: Reading Iran's Pharma Ecosystem as a Market System
This report builds an outside-in structural view of a selected part of Iran's pharmaceutical industry: which companies sit together, how their business and access models differ, where competition occurs, and why neither a single number nor a single digital channel is sufficient for strategic judgment.
The four selected ecosystems are not the whole market, and public-data quality is not equal across them. The main output is therefore not a “winner ranking,” but a framework for asking more precise questions: What exactly is the market and denominator? In which therapeutic area is a competitor defined? Who is the real stakeholder? What role does each digital asset play? How far is a KPI from the business outcome it is supposed to represent?
For a company-specific conclusion or a specialist audit of Digital Footprint, Search, Social, PR/UGC, HCP/Patient Journey or Measurement, the scope and project data need to be defined separately.
Sources for the Iran Pharma Ecosystem Analysis
This article was developed by collecting, cross-checking, classifying and interpreting public online data. The structures of the Cobel, Actover, CinnaGen and Behphar/Behestan ecosystems were reviewed at company, role, relationship and selected market-layer levels. Scope, date, relationship type and metric type were evaluated separately.
Primary Sources
- Darou & Salamat — current CinnaGen structure and group scale claims
- CinnaGen — Our Business
- CinnaGen — official history
- EMA — Zandoriah EPAR
- Orchid Pharmed — Our Story
- Orchid Pharmed — Departments
- OrchidLife — About Us
- Sina Pakhsh Tamin — About
- Sina Pakhsh Tamin — Warehouses
- Turkey Competition Authority — Yerlika transaction
- IranStatis — supplier ranking 1403
- Tacodal — pharmaceutical industry analysis 1404
- IRNA — pharmaceutical market value 1404
- Salamat News — pharmaceutical import-market data
- Behphar — group structure
- Cobel Group — official website
- Cobel Group — Our Companies
- Sahmino — current Abidi shareholders
- Cosar — integration with Cobel/Abidi
- Sahmino — current Cosar shareholders
- Sahmino — current Amin shareholders
- Actoverco — official website
Complete Public Source List
Market data and analytical reports 9 links
- IranStatis — pharmaceutical yearbook 1403
- Tacodal — pharmaceutical industry 1404
- IRNA — pharmaceutical market 1404
- Salamat News — imports
- Darou & Salamat — CinnaGen 1405
- Zoomit — Zist Arvand Pharmed and CinnaGen
- Digiato — CinnaGen production lines
- Bourse24 — Darvand introduction
- Vista — Darvand introduction
CinnaGen and core companies 10 links
Orchid, patient support and distribution 14 links
- Orchid Pharmed
- Orchid Pharmed — Our Story
- Orchid Pharmed — Departments
- Orchid — e-Rx code tool
- OrchidLife
- OrchidLife — About
- OrchidLife — training and injection centers
- AlefLife
- Sina Pakhsh Tamin
- Sina Pakhsh — About
- Sina Pakhsh — Warehouses
- Rasmio — Zist Orchid Pharmed
- Rasmio — Sina Pakhsh Tamin
- JobVision — Orchid Pharmed
Yerlika and commercial partners 12 links
Cobel ecosystem — ownership, manufacturing, API, consumer health and distribution 31 links
- Cobel Group — official
- Cobel Group — Our Companies
- Cobel Darou
- Dr. Abidi
- Sahmino — Abidi shareholders 1405
- Rasmio — Cobel Salamat
- Adorateb
- Adorateb — Cobel Darou
- Adorateb — Abidi
- Adorateb — Behvazan
- Behvazan
- Avan Chemi
- Avan Chemi — About
- IranTalent — Avan Chemi
- LinkedIn — Ofogh Tadbir Salamat
- Nature’s Plenty — About
- Rasmio — Ofogh Tadbir Salamat
- IranTalent — Homa Pars Daroo
- Rasmio — Homa Pars Daroo
- BoursePress — Homa Pars acquisition
- Cosar — About
- Sahmino — Cosar shareholders 1405
- IranTalent — Cosar
- Amin Pharma
- Amin — About
- Sahmino — Amin shareholders 1405
- IranTalent — Amin
- Disclosure relay — Abidi acquisition of ownership vehicles
- Historical Cobel/Almagen profile
- Scientific literature — Cobel/Almagen
- IranTalent — Pharma Operations
Behphar / Behestan — holding, Market Access, manufacturing, distribution, plasma, CHC and specialty therapeutics 28 links
- Behphar — official
- Behphar — About
- Behphar — Group companies
- Behestan Darou
- Behestan Darou — About
- Rasmio — Behestan Darou
- IranTalent — Behestan Darou
- LinkedIn — Behestan Darou
- Behestan Darou — Innovation platform
- Darousazi Behestan / Manufacturing
- Rasmio — Darousazi Behestan
- LinkedIn — Behestan Tolid / historical name
- Behestan Pakhsh
- Behestan Pakhsh — About
- Rasmio — Behestan Pakhsh
- IranTalent — Behestan Pakhsh
- Behestan Plasma
- Rasmio — Behestan Plasma
- ISNA — Ahvaz plasma center / management claims
- Rasmio — Behestan Plasma Alborz
- Behestan Behdasht / CHC
- Rasmio — Behestan Behdasht
- LinkedIn — Behestan Behdasht
- Instagram — Behestan CHC
- Valean Darou
- Valean — About
- Valean — Global Partners
- Rasmio — Valean Darou
Actover ecosystem 18 links
- Actoverco
- Actoverco — About us
- Actoverco EN — Homepage
- Actoverco — History of establishment
- Actero Pharma
- Ati Pharmed
- Alborz Zagros — About us
- LinkedIn — Alborz Zagros
- PitchBook — Alborz Zagros
- Tracxn — Alborz Zagros
- Rasmio — Alborz Zagros
- JobVision — Alborz Zagros
- Nexus Pharmaco
- Actobiochem
- Elite Darou
- Actotech Accelerator
- Instagram — Alborz Zagros
- Actoverco — Global Drug Distribution Company
Disclaimer and Source-Use Method
This report is based on the collection, cross-checking, classification and analysis of public online data available through 9 Shahrivar 1405 (31 August 2026). Responsibility for this report is limited to the method of collection, classification and interpretation of published information; the initial factual accuracy of each item remains dependent on its original publishing source. The information has not been independently audited or confirmed against internal company data and may change over time.
Sources are listed so readers can review, trace and independently evaluate the evidence. Inclusion of a link does not mean endorsement of every claim made by that source. This content is not investment, legal or medical advice and should not be treated as a definitive statement of market share, economic ownership or internal company performance. Documented corrections, structural changes and newer public evidence are welcome.

Senior Digital Marketing Strategist
Over the past 12+ years, I’ve held many titles in digital marketing and online business development. I’ve learned from experienced people, taught students, mentored interns, led managers, built teams, made mistakes, and occasionally discovered ideas that worked surprisingly well. I’m still learning, still experimenting, and still excited to share my thoughts.